×
HIRA Software

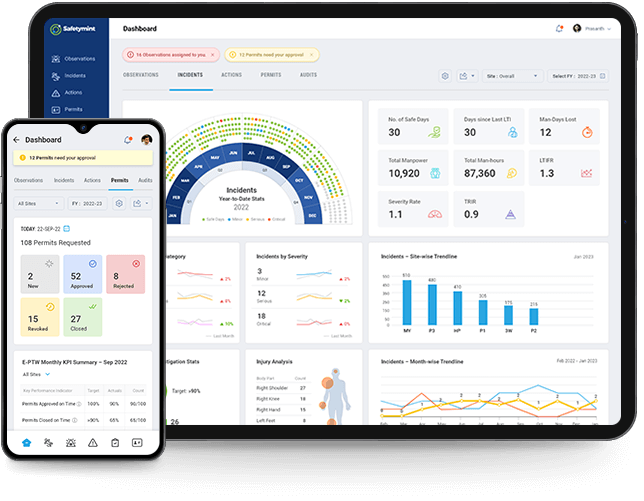
Get all your safety metrics in one unified dashboard.

When your safety processes are handled by different entities within the organization, it is critical to have a single source to track and evaluate the key performance indicators (KPIs).

Safetymint’s Safety Dashboard assimilates key safety metrics from varied sources and processes it to display the data as user-friendly and creative charts and graphs. This drastically cuts down the time taken to create reports manually on spreadsheets.

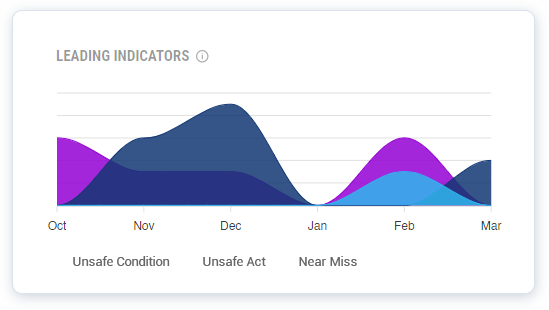
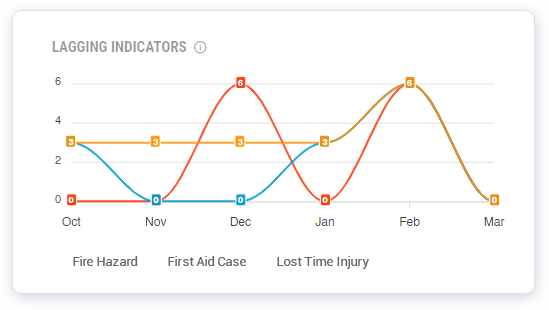
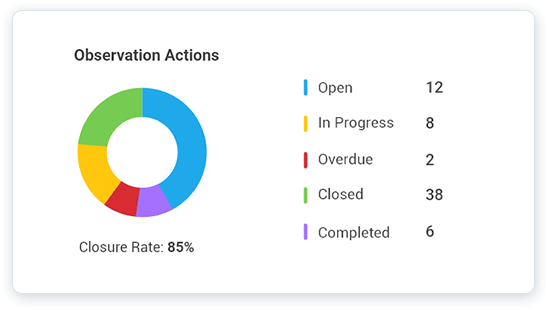
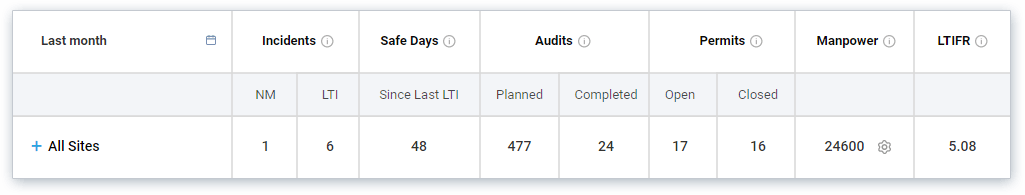
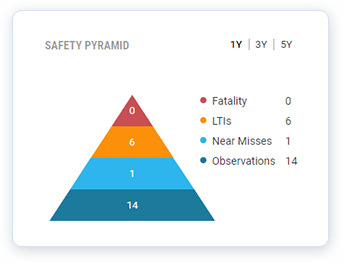
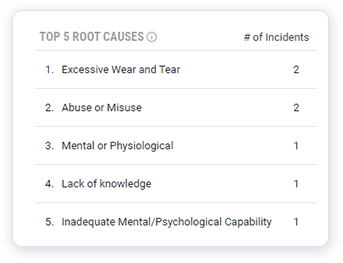
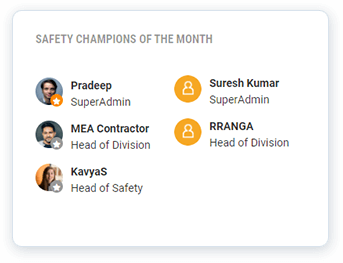
The SaaS version of Safetymint includes the following reports in the Safety Dashboard: Leading Indicators, Lagging Indicators, Action Summary, Monthly Overview, Safety Pyramid, Top Root causes and Safety Champions. The Enterprise version of the software allows you to customize the dashboard to include much more reports and predictive analytics.

The safety reports you need, when you need.

Leading Indicators

Leading Indicators

Leading indicators offers a predictive analysis of your safety performance. This helps in being proactive with your safety activities and aids in preventing incidents before they happen.


Lagging Indicators

Lagging Indicators

Lagging indicators focuses on past incidents, injuries and days away from work over a period of time and helps safety managers analyze if you achieved your safety goals.


Leading Indicators

Action Summary

The Action Summary gives you a quick update on the number of safety incidents that are open, closed, in-progress or overdue. Clicking on each can reveal more details on each issue.


Monthly Overview

Get an overview of the safety activities for any particular month. Drill down the data by individual sites or departments within your organization.

Proactive record
 Review and Publish Risk

Safety Pyramid

The safety pyramid, also known as accident triangle or Heinrich’s triangle, shows the relationships between number of observations and incidents that result in a fatality. Safetymint dashboard allows the statistics to be viewed over a 1, 3 or 5 year period.

Proactive record

Top Root Causes

With Root Cause Analysis, you can unravel the core issue that leads to non-conformance and take preventive steps to eliminate its re-occurrence. Safetymint Dashboard lists the top 5 root causes with the number of incidents listed along with each.

Proactive record
Proactive record

Safety Champions:

Develop a safety culture in your organization by involving every employee within the company to report safety incidents or violations. Recognize and reward the most attentive and proactive employee within the team.

Here’s how a safety dashboard can help you.

A digital safety dashboard helps in identifying the strengths and weaknesses of the safety processes in your organization. It gives the senior management a ringside view of all safety processes without sifting through multiple files. The historical data allows for senior safety professionals to gain valuable insights and take informed decisions. Here are some of the benefits of having a digital safety dashboard:

  • No need of manual intervention in creating reports. The data you’ve already fed will automatically get processed and displayed
  • Allows you to filter your reports based on Date range or Sites
  • The dashboard gets auto refreshed every 5 seconds, so you get the latest data
  • You can export and print critical reports in spreadsheet format

Broadcast your dashboard

With just one click, broadcast real-time safety statistics on a LED or Smart TV.

Getting started is easy… and free!

The 14-day free trial of Safetymint gets you access to all the modules and for unlimited usage. There’s no commitment, no long-term contracts or credit card required.

Looking for a customized safety dashboard? Get in touch.
Take a free trial
Request demo