Project real-time safety statistics on LED, touch or smart screens
Digital / Electronic notice boards are so outdated. We, at Safetymint, wanted to give this a facelift and make it more interactive. For HSE Leaders and Management who want to get up-close and double-click to details, we have made our Safety Dashboard not just fancier but also inclusive and insightful. A small improvement to our earlier version. Nevertheless, a step further in our vision to make safety statistics simple and meaningful.
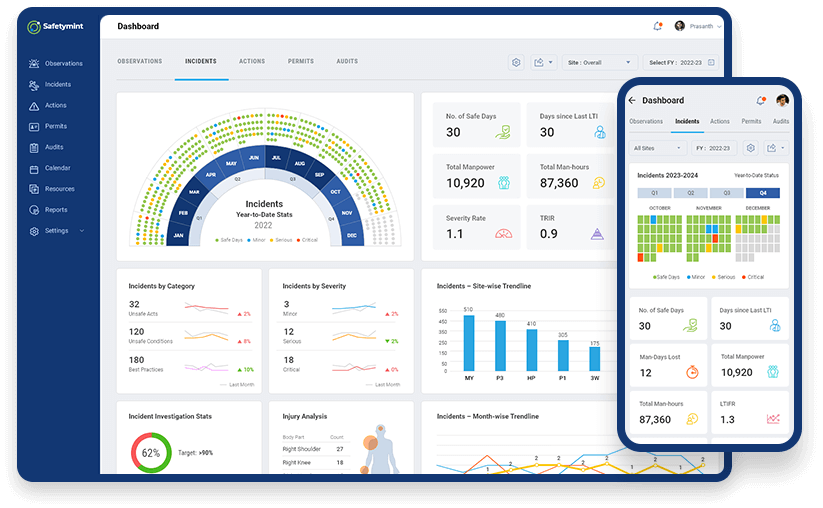
You can now use the “broadcast” icon to project the dashboard of your Safetymint account to a full-screen mode. This page auto-refreshes every 5 seconds, giving you the near real-time data of your safety metrics. Some of these include …
- Leading Indicators – Number of Observations and Near Misses Reported
- Lagging Indicators – Number of LTIs and Fire Hazards Reported
- Status of Open, Closed and Overdue Actions
- LTIFR – Lost Time Injury Frequency Rate
- Number of Safe Days
- Number of Permits Open and Closed
- Number of Audits Planned and Completed
What’s more. You can get a consolidated view of all your sites, or drill down to one particular site as well. Or if you wish to see it over time, we have the date range option for 3-months, 6-months, current and last year data … all at a single click.
That’s not all. We believe safety is everyone’s responsibility. And to make it inclusive and participative, we have a leaderboard featuring the top Safety Champions at your workplace, a Safety Pyramid stats with a 1-year, 3-year and 5-year view; and also the Top 5 Root Causes of incidents investigated.
Related read: Our listing of the best EHS Software.
We are working to add more intelligence to your Safety Dashboard. Our aim is to help Safety Professionals make informed decisions and keep track of their initiatives from planning to closure. As always, we are all ears. We would love your feedback and ideas to help improve this further.
Learn all about leading and lagging indicators
Read our detailed guide on how to write an incident report.

K Pradeep is the Founder and Head of Product Development at Safetymint