
What is TRCF? A Practical Guide to Safety Metrics
I’ve seen teams celebrate “zero LTIs” for months… and still have a workplace that feels chaotic, reactive, and frankly, unsafe in subtle ways.
That disconnect usually comes down to what you’re measuring.
If you’re only tracking serious injuries, you’re missing the bigger picture. That’s where TRCF (Total Recordable Case Frequency Rate) steps in. It doesn’t just focus on the worst outcomes. It captures the full spread of recordable incidents, from medical treatment cases to restricted work injuries.
And once you start looking at safety through that wider lens, patterns start to show up. The near misses you ignored. The recurring minor injuries. The gaps in supervision or training that never quite made it to the dashboard.
TRCF is not just another acronym. It’s a more honest reflection of what’s actually happening on the ground.
What is TRCF (Total Recordable Case Frequency Rate)?
TRCF measures how often recordable workplace incidents occur over a standardized number of working hours.
Simple idea. Wider coverage.
Unlike metrics that focus only on severe injuries, TRCF includes:
- Medical treatment cases
- Restricted work cases
- Lost time injuries
- Any other OSHA-recordable incidents
That broader scope is exactly why I tend to trust TRCF more when trying to understand what’s really going on inside a site or facility. Minor incidents are usually early warning signals. Ignore them long enough, and they escalate.
How to Calculate TRCF

At its core, TRCF is a frequency rate. You are standardizing incident data against total hours worked so comparisons are fair across teams, sites, or even companies.
Here’s the formula:
TRCF = (Total Recordable Cases × 1,000,000) ÷ Total Hours Worked
A few notes that often get missed:
- The multiplier (1,000,000) represents one million man-hours
- Some organizations use 200,000 instead, especially in the US, to align with 100 full-time workers
- Consistency matters more than the multiplier itself. Pick one and stick to it
Quick example
- Total recordable cases: 12
- Total hours worked: 800,000
TRCF = (12 × 1,000,000) ÷ 800,000 = 15
That number by itself doesn’t mean much until you compare it over time or against benchmarks.
What TRCF Actually Reveals (That Other Metrics Miss)
This is where things get interesting.
A low LTIFR can make leadership feel comfortable. But TRCF often tells a different story.
I’ve seen sites with:
- Zero lost time injuries
- But rising medical treatment cases
- And frequent minor incidents that never triggered escalation
That’s not a “safe” site. That’s a site sitting on risk.
TRCF helps you spot:
- Recurring low-severity incidents that point to systemic issues
- Weak supervision or inconsistent procedures
- Training gaps that don’t show up in serious injury data
- Complacency creeping into operations
Think of it this way. LTIs are outcomes. TRCF captures behavior patterns leading up to those outcomes.
TRCF vs LTIFR: Not the Same Game
People often compare these two, but they serve very different purposes.
| Metric | What it Measures | What it Misses |
| TRCF | All recordable incidents | Severity differentiation |
| LTIFR | Only lost time injuries | Majority of smaller incidents |
Where LTIFR Works Well
- Tracking serious injury trends
- External reporting and compliance
- Benchmarking at a high level
Where LTIFR Falls Short
- Ignores minor injuries and restricted work cases
- Can look “good” even when unsafe behaviors exist
Where TRCF Adds Value
- Gives a fuller picture of workplace safety
- Highlights early warning signs
- Helps identify patterns before escalation
If you had to pick just one metric to improve operational safety, TRCF would be the better choice in most cases. But in reality, you need both. One shows severity. The other shows frequency and exposure.
TRCF and TRIR: Why They’re Often Used Interchangeably

This is where confusion creeps in.
TRCF and TRIR (Total Recordable Incident Rate) are, in most practical scenarios, the same thing.
Different industries. Different naming preferences.
- TRIR is more common in the US
- TRCF or TRCFR shows up more in international reporting
Both use the same logic:
- Count total recordable incidents
- Normalize against hours worked
- Apply a standard multiplier
So if someone says TRIR instead of TRCF, don’t overthink it. The calculation and intent are aligned.
The only thing to watch for is the multiplier used. That’s where numbers can look different even when performance is identical.
Making TRCF Useful Instead of Just Another KPI
Here’s where most organizations get it wrong.
They calculate TRCF.
They report it monthly.
And then… nothing changes.
A number on a dashboard does nothing unless you act on it.
If you want TRCF to actually drive improvement:
1. Break It Down
Don’t look at one overall number.
Split TRCF by:
- Site
- Department
- Contractor vs employee
- Type of incident
Patterns live in the details.
2. Track Trends, Not Snapshots
A single month means very little.
Look at:
- Rolling 3-month trends
- Year-on-year comparisons
- Spikes after specific activities or projects
That’s where you’ll start seeing cause and effect.
3. Link It to Action
Every recordable case should trigger:
- Root cause analysis
- Corrective actions
- Follow-up verification
If your TRCF is rising but your action closure rate looks perfect, something is off. Either actions are weak or problems are being misclassified.
4. Combine with Leading Indicators
TRCF is still a lagging metric.
Pair it with:
- Safety observations
- Near-miss reporting
- Inspection scores
- Training completion rates
That combination gives you both hindsight and foresight.
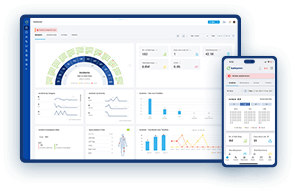
Where Tools Like Safetymint Fit In
Manually tracking TRCF is possible. Scaling it across multiple sites is where things start breaking.
You need:
- Consistent incident classification
- Real-time data capture
- Automated calculations
- Visibility across teams
That’s where structured EHS platforms come in. Not just to calculate TRCF, but to connect it with actions, trends, and accountability.
Otherwise, you’re just maintaining a number without context.
This article was generated with the assistance of AI and reviewed by Ben Johnson for accuracy and quality.
Ben Johnson is a dedicated Customer Success Executive at Safetymint. With a strong commitment to excellence, Ben works closely with customers to ensure they fully leverage the capabilities of Safetymint to its fullest potential, aiming to significantly reduce or mitigate safety risks and incidents.