From the Founder’s Desk: Safetymint® Performance Report 2021-25
“Are we doing it right?” That one question often weighs my mind. It nudged me to look beyond customer calls, testimonials, support tickets, and pull together actual data from across industries, and run it through careful, AI-assisted analysis. The results surprised us and encouraged us. For a young product team like ours, the signals were consistent: steady usage, richer observations, and measurable gains—not just more safe hours, but fewer injuries and avoidable costs each day.
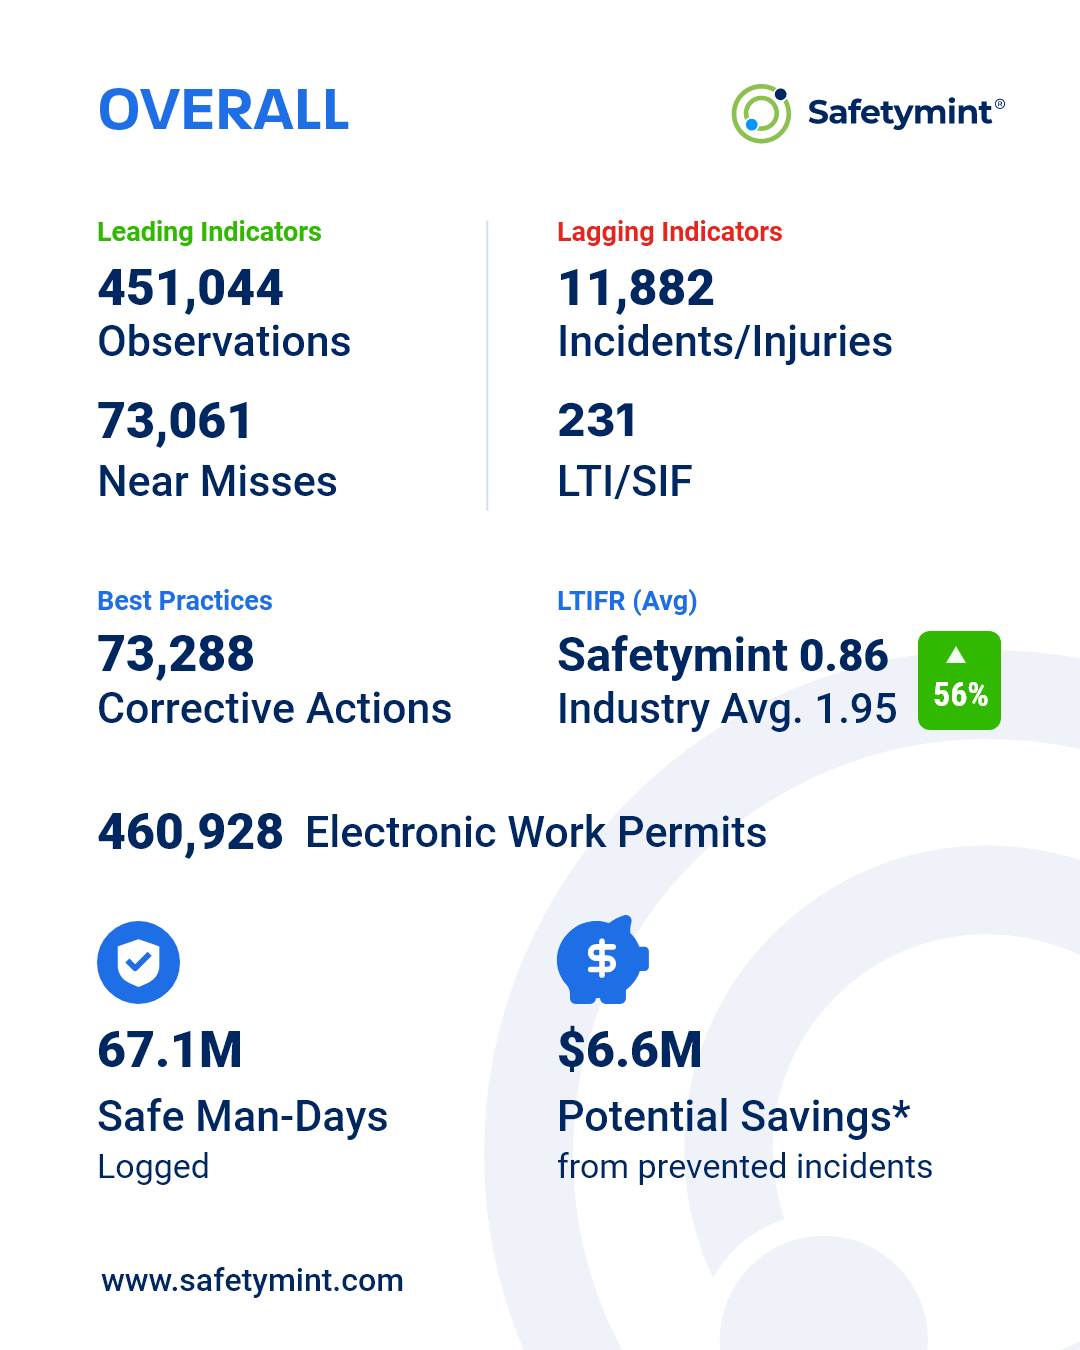
Our latest performance report covers the period from 01 Sep 2021 to 31 Aug 2025, and the data gives us cautious optimism that the platform is adding up to meaningful impact.
On LTIFR, our customers average 0.86 compared to an industry 1.95—roughly 56% better by this metric. These figures come from logged data, and we’re mindful that variations in reporting or usage can influence results. Our focus is on improving completeness and consistency so the signal remains trustworthy.
And when you translate safer operations into actual days of steady work, our customers collectively report 67.1 million safe man-days. Conservatively applying a standard cost model, this corresponds to a minimum of $6.6M in potential savings from prevented incidents. Again, these are conservative estimates – the real human value is far larger.
What moved the needle?
This progress didn’t come from one big feature; it came from thousands of small, consistent actions by users:
- The leading indicators: 390,752 observations and 72,646 near misses were recorded, creating the early-warning system any safety culture needs.
- On the lagging side, teams still logged 10,711 incidents/injuries, but importantly, they also captured 231 Serious Injuries and Fatalities (SIF) … with lessons learnt that can help eliminate risks and hazards, and prevent recurrence.
- Best Practices: We saw 73,288 corrective actions being tracked from assignment to closure and over 4.6 lakhs electronic work permits being issued, eliminating double the amount of paper …
To me, the story here isn’t that “we’re perfect.” It’s that people are using the system to see more, learn faster, and share better. When a near miss is logged and a corrective action is closed, that’s a risk retired – not just recorded.
Industry snapshots (small sample, steady signals)
Different industries start at different baselines, and every site has its own realities. But the directional improvements we’re seeing with Safetymint® across sectors are encouraging:

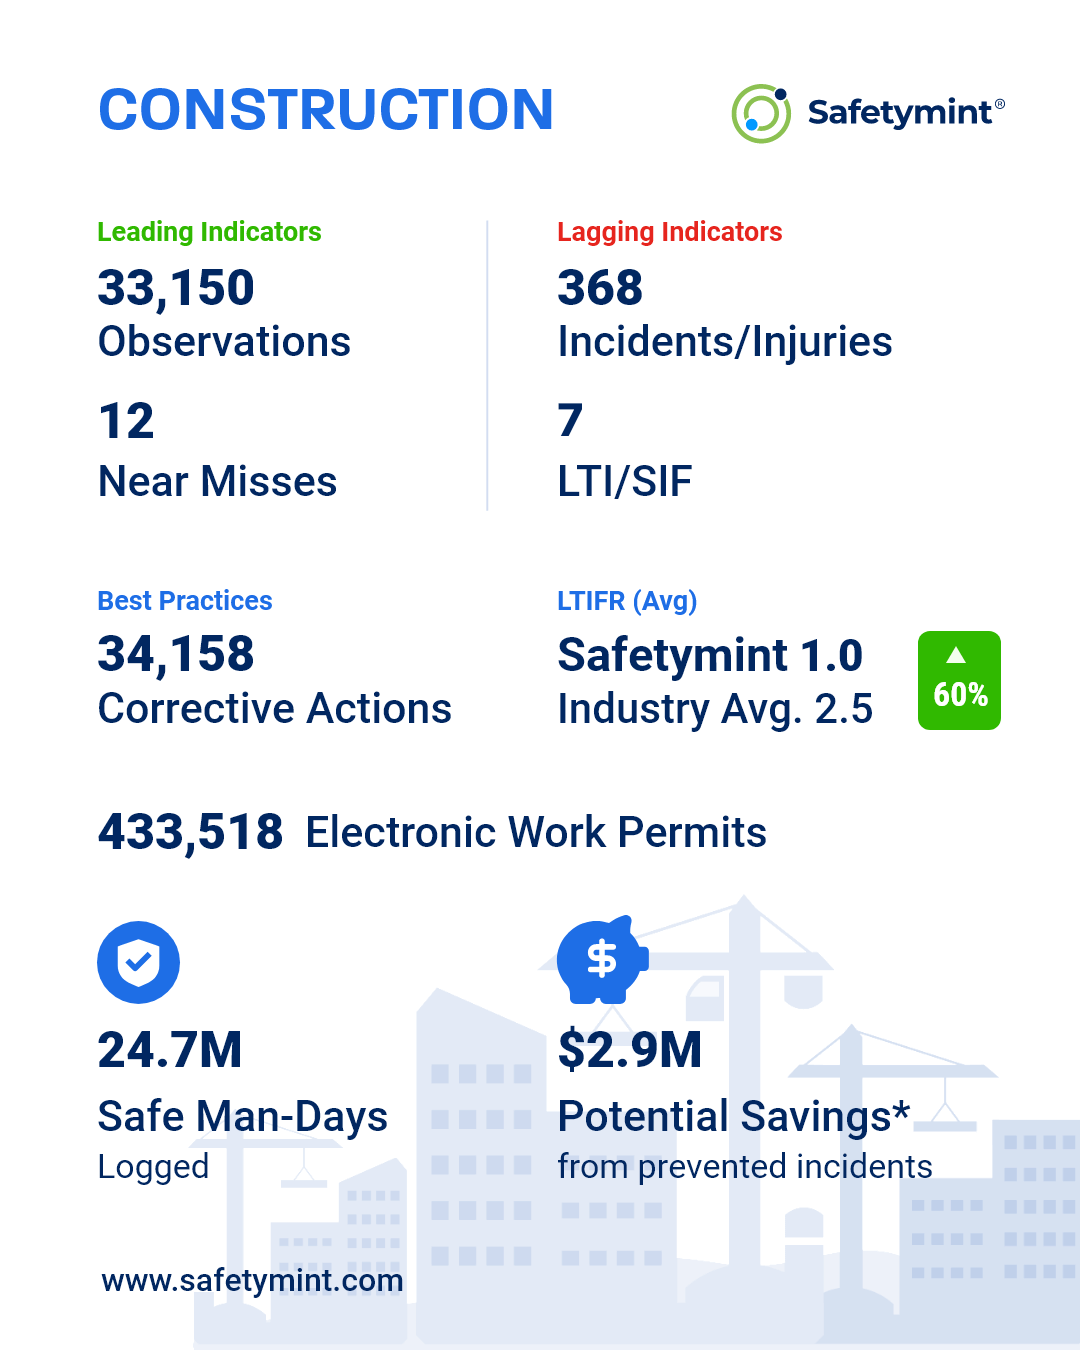
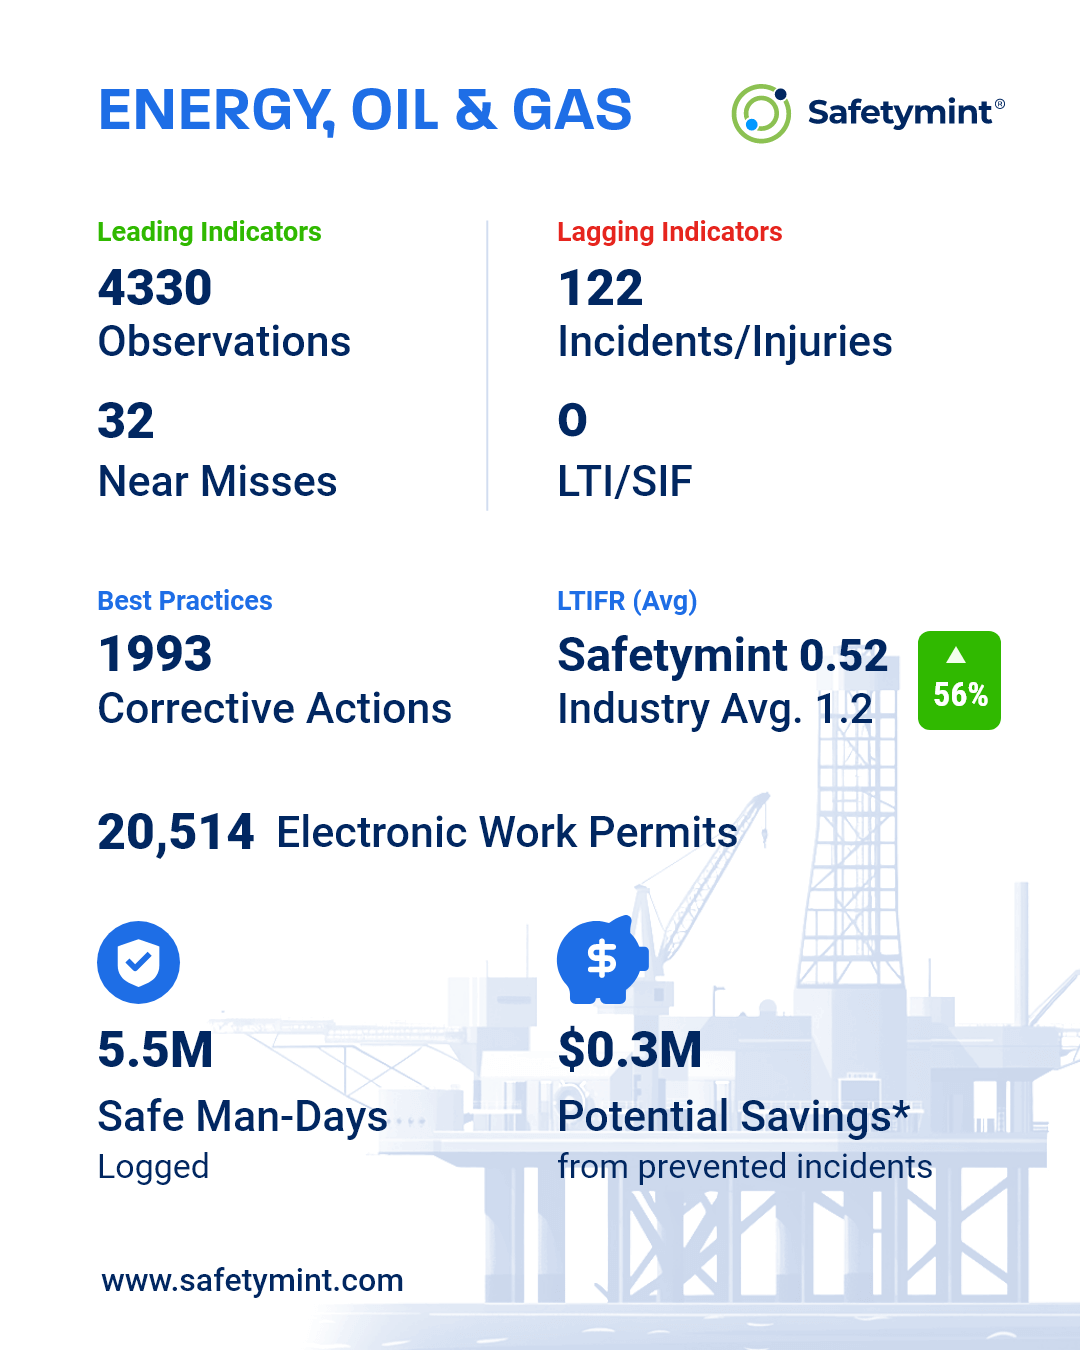

These numbers didn’t appear overnight. They’re the result of supervisors nudging for better observations, HSE teams refining checklists, and workers taking the time to report what they see. It’s quiet work that rarely makes a headline, but it saves lives.
How we think about “savings”
In the report, we’ve used a conservative cost basis of $40,000 per incident to estimate potential savings. Actual costs are often higher when you consider disruption, investigations, lost productivity, and long-term consequences for people. Our intent is not to put a price tag on safety—it’s to help leadership justify sustained investment in prevention.
What we’re learning about user behavior
The volume of observations tells us that the fastest path to fewer injuries is still the same: make it easy for people to speak up early. When near misses are captured at scale and best practices are documented and searchable, you start seeing compounding benefits—what one team learns today protects another site tomorrow.
We’re also noticing that when teams close corrective actions promptly, the ratio of near misses to incidents improves over time. That’s why we continue to refine workflows and nudges that reduce friction: fewer clicks to log a hazard, clearer routing for action owners, and better summaries for weekly reviews.
A small team, a big responsibility
We’re a lean, product-obsessed team. We don’t get everything right the first time, and we’re grateful for customers who push us with honest feedback. The progress in this report reflects their discipline in using the platform as much as it reflects our work in building it. The mission is simple, but not small: help reduce workplace injuries and save lives—quietly, steadily, and measurably.
Where we’re headed …
- More signal, less noise: Continue improving the quality of leading indicators, so what gets reported is truly actionable.
- Faster follow-through: Make it even easier to assign, track, and verify corrective actions across shifts and contractors.
- Clearer context: Strengthen qualitative reporting so insights are not just numbers, but stories teams can learn from.
We’ll keep shipping, keep listening, and keep measuring.
Thank you to every HSE leader, supervisor, and worker who trusted us with your safety data and your time. If this report shows anything, it’s that steady progress beats loud promises. We’ll stay humble, keep our heads down, and do the work.
Thank you to every HSE leader, supervisor, and worker who keeps our heads down, and does the work.
Download PDF
K Pradeep is the Founder and Head of Product Development at Safetymint